In MOSS 2007 we have an interesting feature - Key Performance Indicators (KPI) List and Web Part. I have done some research around that matter.
First I would like to show how to create KPI list with several indicators and then I would like to share some ideas for real life.
KPI List
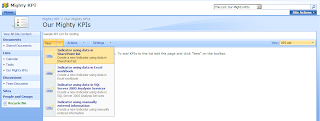
When the KPI List is created we can add new indicators to that list.
First will be manual indicator:
 This type of indicator is very simple and almost useless for real scenarios:

It is for scenarios like "we just want to display some KPI".
Next will be indicator based on SharePoint list:

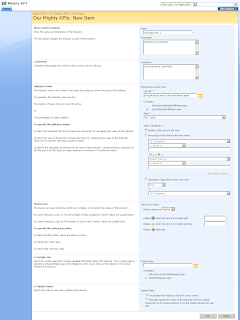
We specify the name, SharePoint list, view of the list and what we are going to count as an indicator:
 When we save it we can see the details view of that indicator:

This option is for scenarios like "number of project tasks completed", "number of issues", "amount of expenses claimed" etc. The limitation of that indicator is that we need to create a view on the list for each indicator otherwise there is no way to set up a criteria for list items.
Next indicator type is Excel Workbook indicator:

In order to create this type of indicator we have to upload an Excel 2007 workbook with indicators to the Excel Services trusted location. Initially I had the following Excel document:
 I pointed to that document in the indicator settings:

 Then I selected appropriate workbook cells to use as the goal for the KPI:

 When I tried to save the indicator I got an error "Goal must be either a number or a valid cell adress":

I added another cell into the workbook and then put that cell as the goal for amber light:

So I have got an indicator based on Excel workbook.
This option is more advanced in comparison to the SharePoint list and manual one. The limitation of that indicator is that we need Excel 2007 and Excel Services in order to use it. It is also just a proxy display for Excel data.
I'm not going to cover the indicator based on SQL Server 2005 Analysis Services, but the idea is the same as with Excel Workbook indicator.
KPI Web Parts aka Dashboards
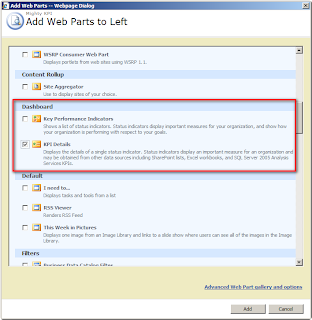
Then I added two Web parts displaying my indicators:


Resolution
Though it is useful out-of-the-box feature of MOSS 2007 there are some serious limitations and disadvantages:
1. It's only available as a part of MOSS 2007 and not WSS 3.0
2. Excel workbook indicator needs Excel 2007 and Analysis Services indicator needs SQL Server 2005 Analysis Services
3. There is no way to customize look and feel i.e. change the indicator images
4. There is no way to define indicator algorythm and source information criteria
5. We need to create a separate list (KPI List) to store information about our data to be able to display a set of indicators about our data. I think it would be easier to have just configurable dashboards rather than indicators lists + dashboards
Next Step
Custom KPI Dashboard which will be available for WSS and which will indicate using data from Dynamics CRM using XSLT for output.
Stay tuned for more articles from Wylde Solutions.
If you have any questions in regard to implementing KPIs and other Business Intelligence features for your company or you need assistance contact us now for a consultation.
UPDATED:
Wylde Solutions released VG Custom KPI View Web Part. This is a Web part that allows you to display key performance indicators using custom images.
Information about the Web part is located at the following link: VG Custom KPI View Web Part
If you have any enquiries please follow link above for contact information.
UPDATED:
I have published a post Key Performance Indicators - Create KPI List and indicator programmatically.
Please check.
First I would like to show how to create KPI list with several indicators and then I would like to share some ideas for real life.
KPI List
When the KPI List is created we can add new indicators to that list.
First will be manual indicator:
 This type of indicator is very simple and almost useless for real scenarios:
It is for scenarios like "we just want to display some KPI".
Next will be indicator based on SharePoint list:

We specify the name, SharePoint list, view of the list and what we are going to count as an indicator:
 When we save it we can see the details view of that indicator:
This option is for scenarios like "number of project tasks completed", "number of issues", "amount of expenses claimed" etc. The limitation of that indicator is that we need to create a view on the list for each indicator otherwise there is no way to set up a criteria for list items.
Next indicator type is Excel Workbook indicator:

In order to create this type of indicator we have to upload an Excel 2007 workbook with indicators to the Excel Services trusted location. Initially I had the following Excel document:
 I pointed to that document in the indicator settings:
 Then I selected appropriate workbook cells to use as the goal for the KPI:
 When I tried to save the indicator I got an error "Goal must be either a number or a valid cell adress":
I added another cell into the workbook and then put that cell as the goal for amber light:

So I have got an indicator based on Excel workbook.
This option is more advanced in comparison to the SharePoint list and manual one. The limitation of that indicator is that we need Excel 2007 and Excel Services in order to use it. It is also just a proxy display for Excel data.
I'm not going to cover the indicator based on SQL Server 2005 Analysis Services, but the idea is the same as with Excel Workbook indicator.
KPI Web Parts aka Dashboards
Then I added two Web parts displaying my indicators:


Resolution
Though it is useful out-of-the-box feature of MOSS 2007 there are some serious limitations and disadvantages:
1. It's only available as a part of MOSS 2007 and not WSS 3.0
2. Excel workbook indicator needs Excel 2007 and Analysis Services indicator needs SQL Server 2005 Analysis Services
3. There is no way to customize look and feel i.e. change the indicator images
4. There is no way to define indicator algorythm and source information criteria
5. We need to create a separate list (KPI List) to store information about our data to be able to display a set of indicators about our data. I think it would be easier to have just configurable dashboards rather than indicators lists + dashboards
Next Step
Custom KPI Dashboard which will be available for WSS and which will indicate using data from Dynamics CRM using XSLT for output.
Stay tuned for more articles from Wylde Solutions.
If you have any questions in regard to implementing KPIs and other Business Intelligence features for your company or you need assistance contact us now for a consultation.
UPDATED:
Wylde Solutions released VG Custom KPI View Web Part. This is a Web part that allows you to display key performance indicators using custom images.
Information about the Web part is located at the following link: VG Custom KPI View Web Part
If you have any enquiries please follow link above for contact information.
UPDATED:
I have published a post Key Performance Indicators - Create KPI List and indicator programmatically.
Please check.
Slava, preved!
ReplyDeleteDerzhis' bodryachkom!
Sergey Frolov
Hi,
ReplyDeleteThe link to the VG Custom KPI View is broken. Could you please send me the new link if this web part is still available?
Thanks,
Tiziana Rosafio
Hi Tiziana,
ReplyDeleteThe link is now fixed. You can get the overview of the Web Part here: http://wyldesolutions.com/Products/WebParts/VGCustomKPIViewWebPart/Wylde%20Solutions%20-%20VG%20Custom%20KPI%20View%20Web%20Part.pdf
If you are interested further or have any other queries, please send us an email with details to sales@wyldesolutions.com
Thank you.
Best wishes,
Slava Gorbunov